Spotting Enron
I recently stumbled upon the Powers Report from 2002. It was an internal investigation led by William Powers who was a member of the board of Enron and chaired the Special Investigative Committee. It’s a 217 page masterpiece on transactions between Enron’s CFO, or the Fastow Partnerships, and the related party deals Enron made. Here’s the link to it.
It goes over what we now know that caused Enron to fail:
1) The accounting for the Special Purpose Entities was just blatantly wrong. If an SPE’s independent owner contributed 3% of the equity and that independent owner controlled the SPE, then the SPE did not need to be consolidated on to Enron’s financials. So someone could put up just 3% and be granted control of the SPE and Enron wouldn’t have to consolidate the SPE on to its books. However, Enron essentially just ignored these rules even if they effectively controlled the SPE for accounting purposes. They also did other work arounds for SPE purposes to hide debt and conceal losses that should have been reported.
The typical SPE transaction would look like this: Enron transfers some of its own shares into the SPE for a note while guaranteeing the SPE value, aka Enron’s share value. The SPE would then hedge an investment on Enron’s balance sheet using Enron’s shares that were just transferred in as payment. Because Enron thought it’s stock would never go down, they didn’t think the guarantees would come due. Once the shares started going down, these guarantees did, infact, come due. The report lays it out better than I can.
2) Extremely aggressive revenue recognition that goosed the numbers. My favourite being Enron contributing its own shares into the JEDI SPE, watching their Enron shares go up, recording their share of the JEDI owned Enron stock that increased as income on their own income statement AND THEN when Enron’s shares went down, they didn’t record any decrease in that income from JEDI’s ownership. Heads Enron wins, tails Enron would still win.
Reading the report made me open up Enron’s 10-K to see if I could see some red flags and what I would have dug deeper on if I had been participating in the markets back then. Overall the 10-K is pretty confusing as multiple notes refer numerous times to other notes that you have to go back and forth to and they don’t make it easy to understand. I’ll link the 2000 annual report here if you’re interested in reading it too.
Enron Annual Report
Let’s start with the income statement…
Red flag #1
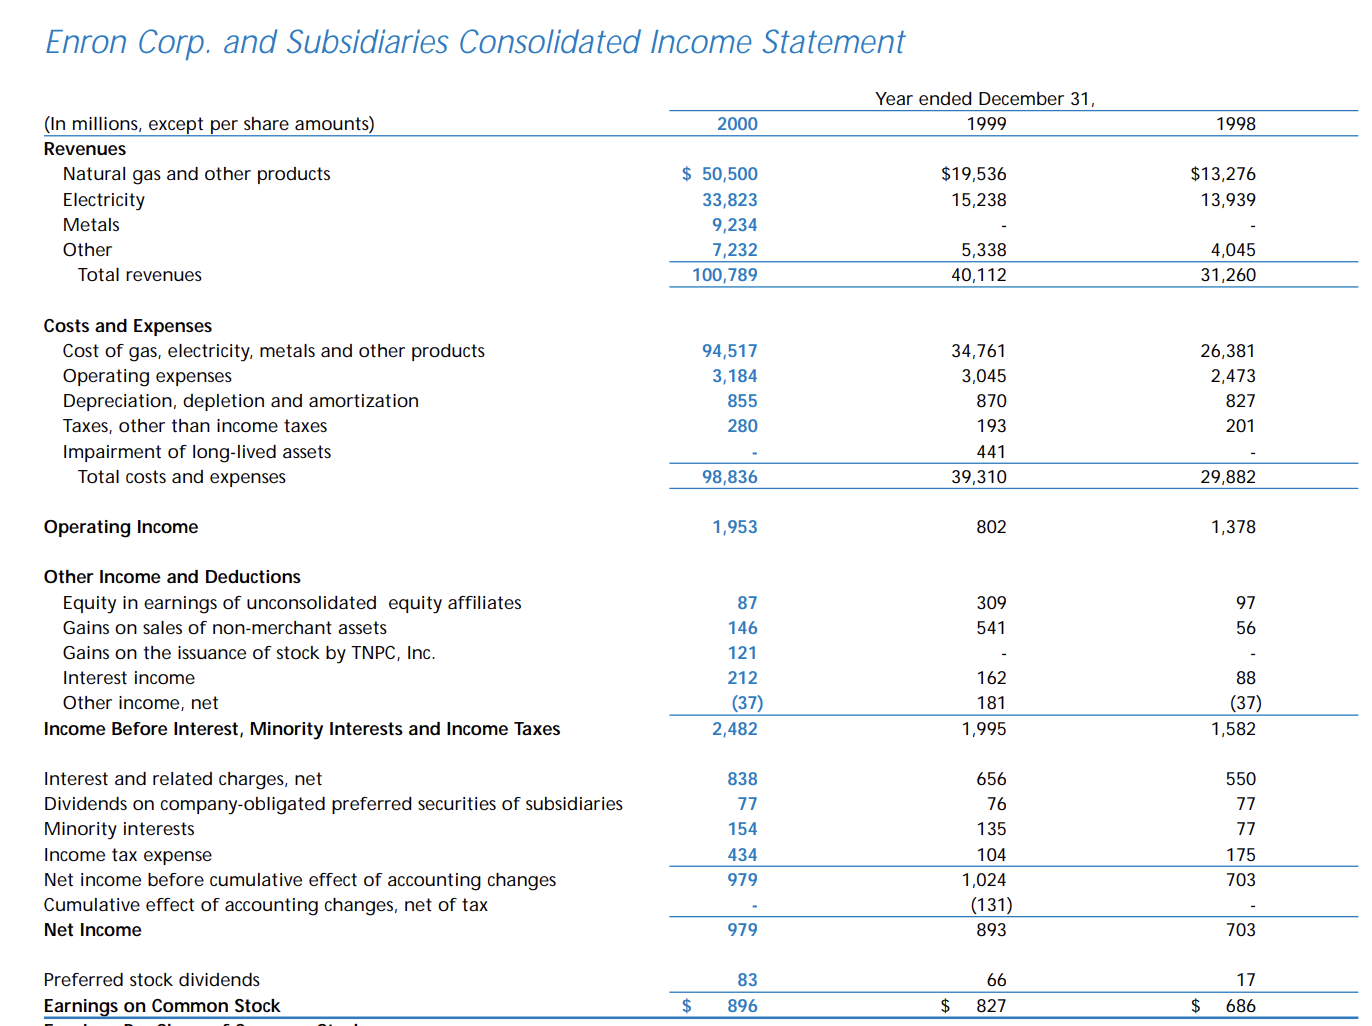
Right off the bat, one of the first things that jumps out is the huge increase in revenues. Revenues were up $60 billion in 2000 or 150%, which is great. But operating income barely budged and actually operating margins went down from 2% to 1.9%. Pretty strange that a company’s revenue increases by $60 billion and there is barely any increase in EBIT margins or EBIT really.
Red flag #2
The “other income and deductions” section is filled with numerous items that seems to increase earnings quite a bit. Tons of games can be played in this area to beat earnings and I’d be suspicious that something like that could have been happening here.
on to the balance sheet…
Red flag # 3
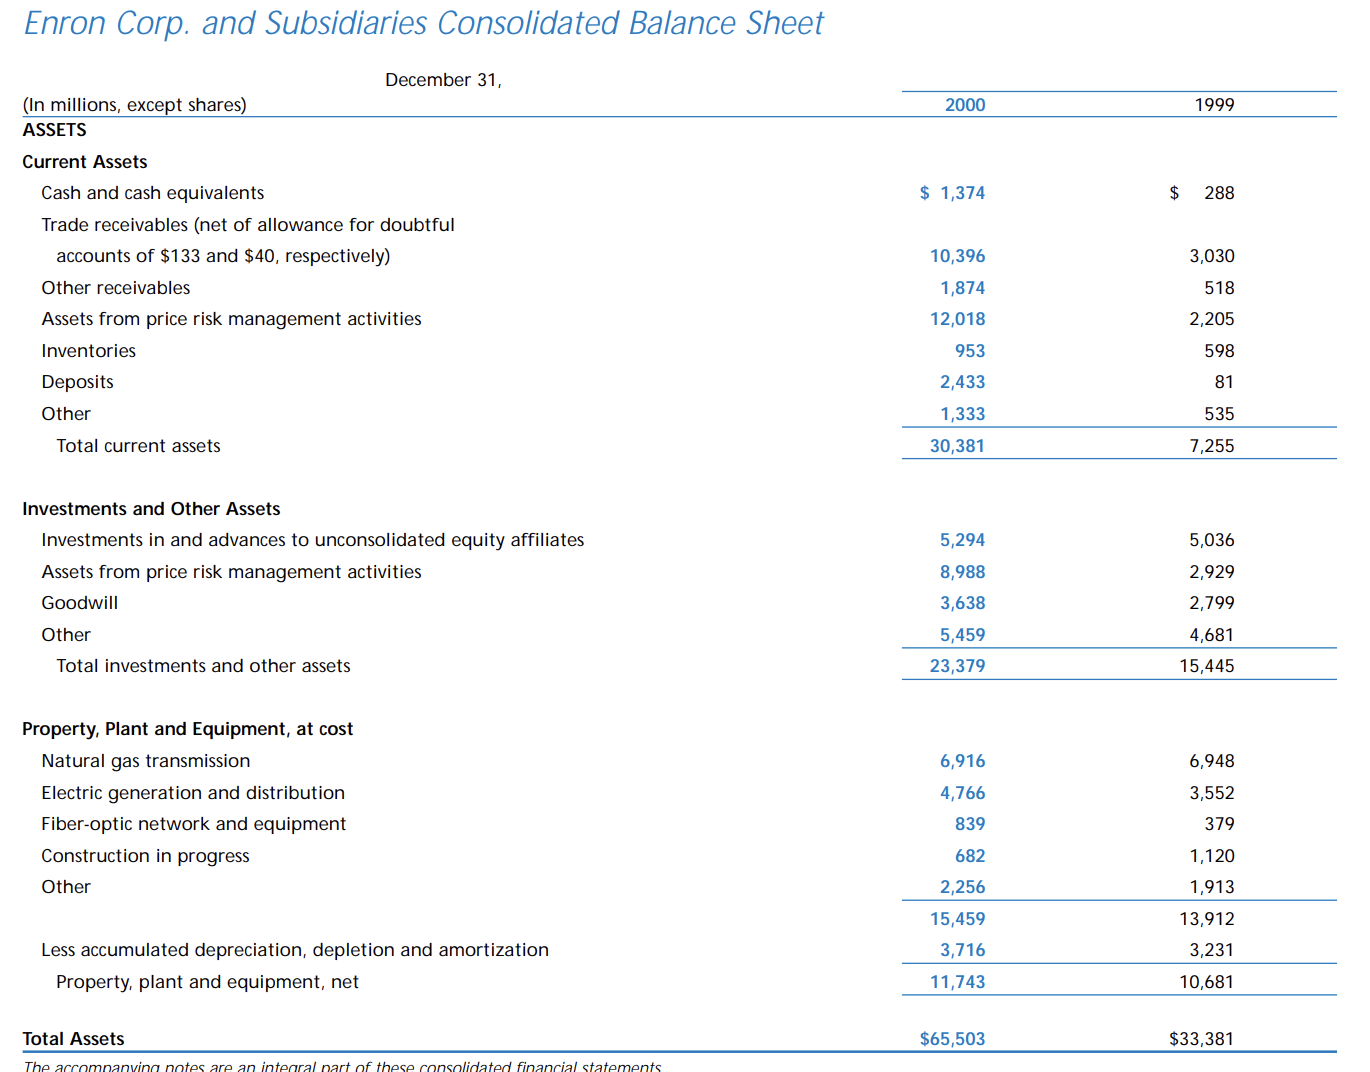
Total current assets jumps from $7 billion to $30 billion which is most of the large increase of total assets from $33 billion to $65 billion. Definitely something strange is happening if none of that is being converted to cash. Days sales outstanding jumps from 27 days to 38 days which is not huge but is definitely not going in the right direction.
Red flag #4
Take a look at the line “other”. It shows up 3 times on the balance sheet in each asset section. The sum total is $9 billion which is 14% of total assets. There is a ton of opportunity for management teams to bury capitalized expenses in here in order for it to not hit the income statement and boost earnings, hoping no one reads what makes up the “other” items.
Red flag #5
What is and why the large jump in the line item “assets from price risk management activities”? I’m not sure I’ve ever seen that item on a balance sheet before. There is a 400% and 600% increase in this asset line in the current and long-term asset section, respectively.
Red flag #6
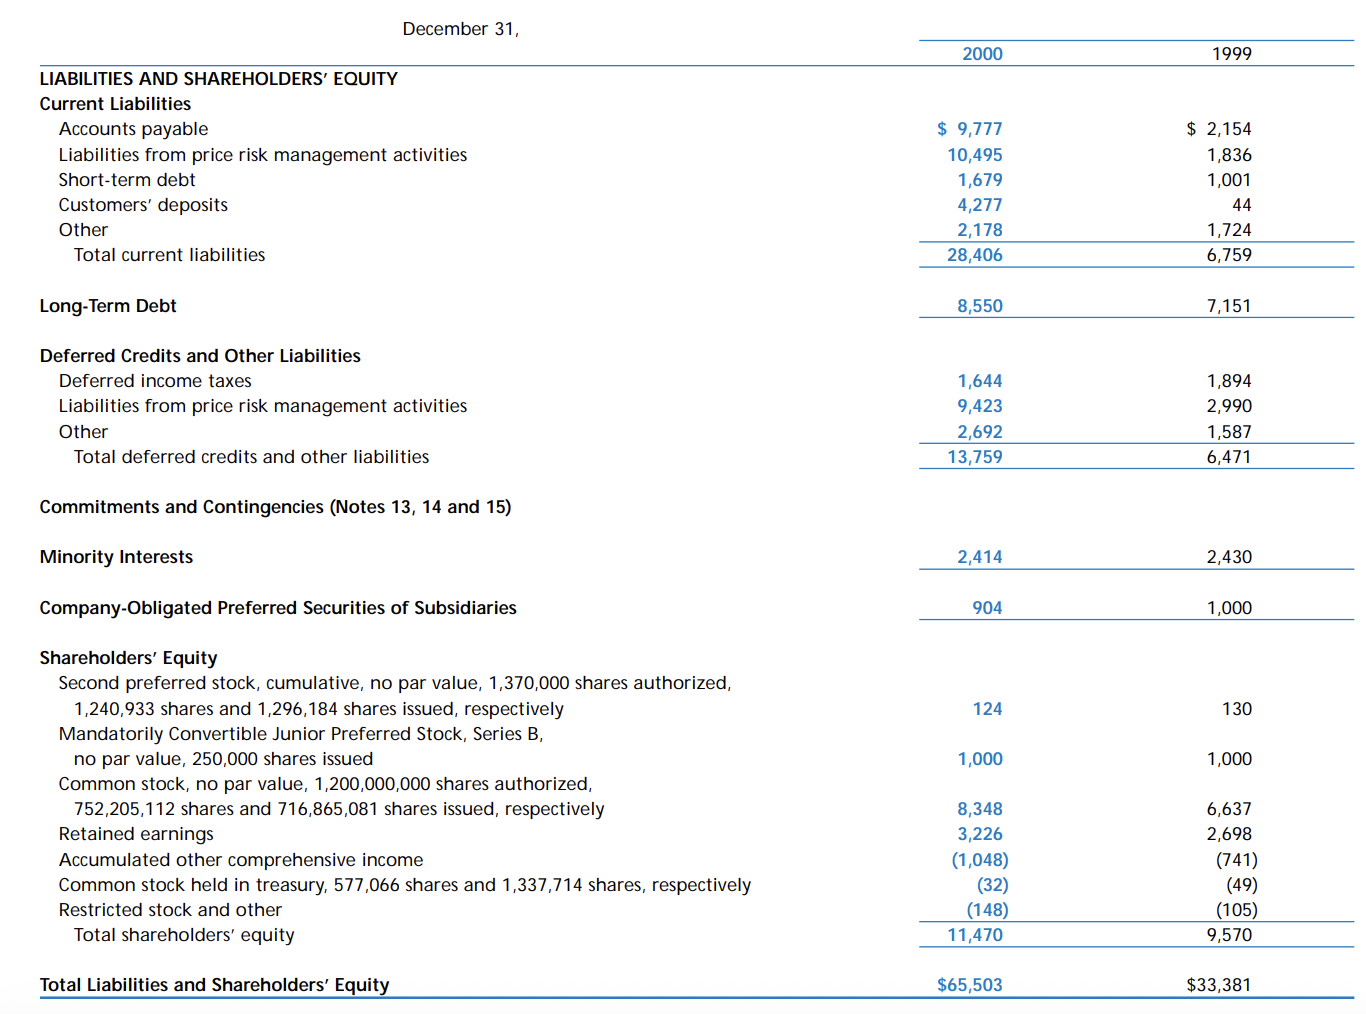
There is nothing that jumps out in the liability section that we haven’t already seen in the asset section. I would just need to know what is sitting in the “other” and “price risk management activities” line items.
Red flag #7
It looks like Commitments and Contingencies has a zero balance but there are 3 separate notes that deal with this which could allude to some type of off balance sheet liability that should be taken into account.
And here’s the cash flow statement…
Red flag #8
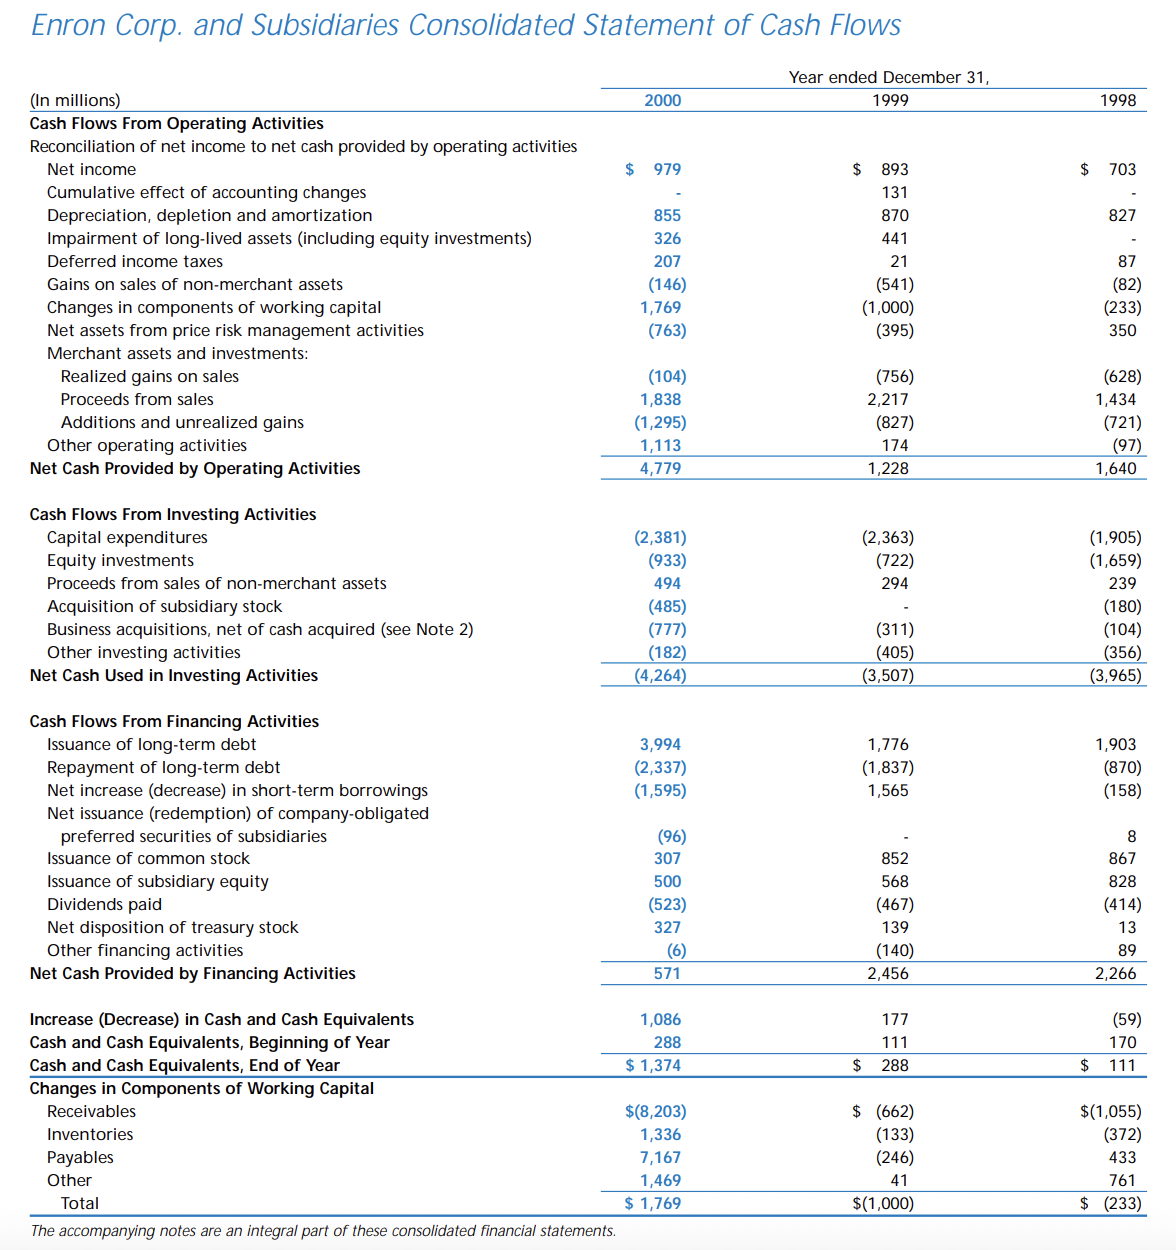
Enron barely made any free cash flow in the 3 years prior to going bankrupt. All of the revenue growth and earnings did not convert into any free cash. A lot of the operating cash flow was actually coming from the sale of their merchant assets. I think some more digging around these investments would have needed to be done. It’s also strange that proceeds from merchant assets was an operating cash flow but proceeds from non-merchant assets was an investing cash flow item.
Notes to the Financial Statements
The notes to the financials were another interesting read. The revenue is based on mark-to-market with the majority of the revenue increase from 1999 to 2000 coming from their Wholesale Energy Services. This is really their trading division and here is how Enron describes it:

I have no idea what any of that means to be honest. But this business went from $35 billion in revenue in 1999 to $93 billion in 2020. And if you read their revenue recognition policy, they use mark-to-market which when selling gas or electricity over a long-term contract, I would imagine there are many ways to game the financials to benefit your company although it’s tough to see without mark-to-market income vs just normal operating income disclosure.
A good article I read said if you look at page 38 on Enron’s 2000 annual report, there is this paragraph regarding the price-risk-management activities:
“The income before interest, taxes and certain unallocated expenses arising from price risk management activities for 2000 was $1,899 million.”
Price risk management activities really means mark-to-market. So Enron generated $1.9 billion in fake earnings from their accounting policy against total operating income in the income statement of $1.9 billion. In other words, they didn’t generate any real earnings which paints a different picture if you just look at the overall income statement and no disclosures.
The most famous passage of Enron’s annual report is their Note 16 - Related Party Transactions. I won’t copy it and paste it all here but it is one of their longer notes. Typically when you read the notes in an annual report, the related party note is minimal if anything at all. Not in Enron’s case. It details, in a confusing manner, transactions with partnerships run by an Enron executive. Everyone should go read it to try and see if they can understand it. I do wonder if you would have been able to pull from the Secretary of State or UCC filing any type of document to get a better picture from behind the scenes in these partnerships.
Wrapping Up
This is just one annual report. I’m sure if you read the 10-Qs, proxy and saw the insider selling you would be able to form an even better picture of what was going on.
TVA Group - Deep Value Turnaround on the Canadian Market
I took a position in TVA group this summer. The stock kept going up each time I tried placing a bid, which I’m sure many of you have experienced. It’s hard to not chase the stock up but when some of the fundamentals seem to have started to shift and the information released to the market confirms your thesis, what seems like chasing a stock up could actually result in an early bull run.
The other week TVA announced Q3 earnings and I wanted to put my notes down to show how undervalued it is still after the massive run up this year. I’m increasingly coming to the idea that a good source of idea generation is to look at the 52-week high list, it helps highlight that something is happening within the business that warrants taking a look. It’s just mentally very tough to buy stocks at 52-week highs.
Overview
TVA Group is a small $128m market cap ($3 share price; 43.3m shares) Canadian listed stock that is majority owned by Quebecor. It is the leading French language television broadcaster with a market share of 43.5% and a couple of other segments that contribute to its undervaluation. In addition to it’s operations, it owns excess hard assets that cover over 100% of the market cap.
Having settled it’s dispute with Bell TV last year and restructured its broadcasting segment, the business seems like it has hit an inflection in terms of earnings and cash flow, having just reported $1.25/share of free cash flow in the first 9 months this year. The balance sheet has also been repaired, having gone from showing constant bank indebtedness and loans owing on the balance sheet to now an $80m net cash position with other surplus assets too. The market has seemed to have also caught on with the stock up over 400% YTD but still remains dramatically undervalued in my opinion.
Segment Value
TVA operates 4 business segments -1) Broadcasting, 2) Film Production, 3) Magazines and 4) Production and Distribution but it is the broadcasting segment that is behind the huge increase in earnings.
TVA has been undergoing carriage fee disputes with Bell the past few years as Bell had been favouring it’s own French channel, RDS, over TVA Sports channel via it’s packaging of channels. This matter appears to have been settled at the end of 2025 as TVA received retroactive payments for carriage fee disputes in 2025 totaling $43.8m with $36.4m of that being due for prior years retroactive adjustments and $7.4m for the year 2025. While there are no details regarding the new agreement, it’s safe to say that it has had the affect of increasing revenue for 2026 and most likely future years.
While the above was going on, TVA had been undergoing a significant cost restructuring plan that also seems to have started to bear real fruit. Back at the end of 2023, TVA realized that the current path they were on wasn’t sustainable as the company had just reported another loss of $13m. The CEO even said as much and the company chose to slash 31% of it’s workforce. The number of employees has gone from 1,172 at the end of 2023 to 795 at the end of 2025 with the majority of those cuts in the Broadcasting division.
Based on the first 3 quarters through 2026, the Broadcasting segment has done $49m in EBITDA. I believe this is a result of the increase in carriage fees from the 2025 agreement as well as the noted cost cuts above that have taken effect.
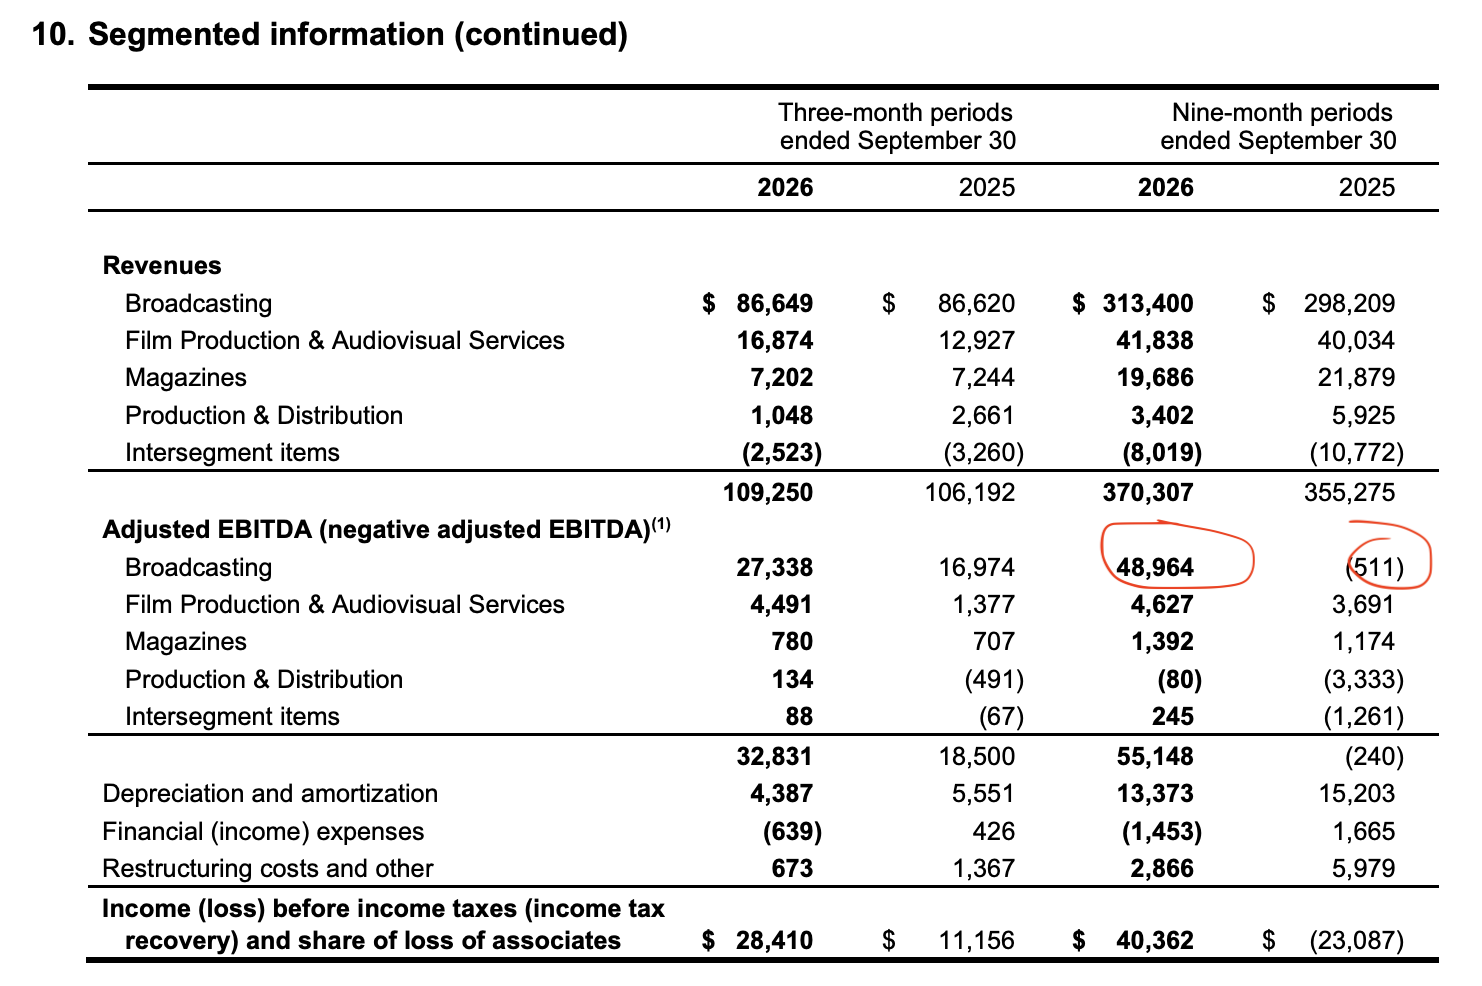
I calculate they’ve done about $54.4m in free cash flow so far this year or about $1.25/share. Judging by these numbers, it seems that the broadcasting division is on much better footing than 1-2 years ago. This number could potentially come down a bit as the company just entered into a 12-year agreement with Rogers for the French-language broadcasting rights to the NHL games. Their last NHL contract was expensive and the terms of this one were not disclosed as far as I know.
Assuming the EBITDA comes down a bit to $25m for the full year and putting a 4x EBITDA multiple on the division, as it is still potentially challenged long-term, you’re looking at $100m for the broadcasting division. Magazines, which owns some French language magazines, does a steady $1.6m in EBITDA. Putting a 3x multiple on it brings it’s value to $4.8m.
The Film and Production segment, MELS, was bought in 2014 for $118m. MELS is tied to the film and entertainment industry by renting out its stages and equipment (cameras, lighting, dollies, etc) to shoot movies and TV shows in the Quebec area. It did $13m in EBITDA in 2024 and $7.4m of EBITDA in 2025. A couple of comparables to this segment would be Facilities by ADF out in the UK that trades at 3.5x. Or Cinelease that was sold by Herc Holdings last year for $100m at approximately 5x EBITDA. Just assuming the $7.4m of EBITDA repeats again in 2026 as they’ve already earned $4.5m YTD and using the multiple Cinelease received in the buyout, this segment would be worth $37m.
However, this understates the underlying real estate the MELS division owns. They own a couple of large industrial buildings that they use for the production studios that total 492,600 square feet. One of the properties is located in Montreal and the other is across the river in Saint-Hubert.
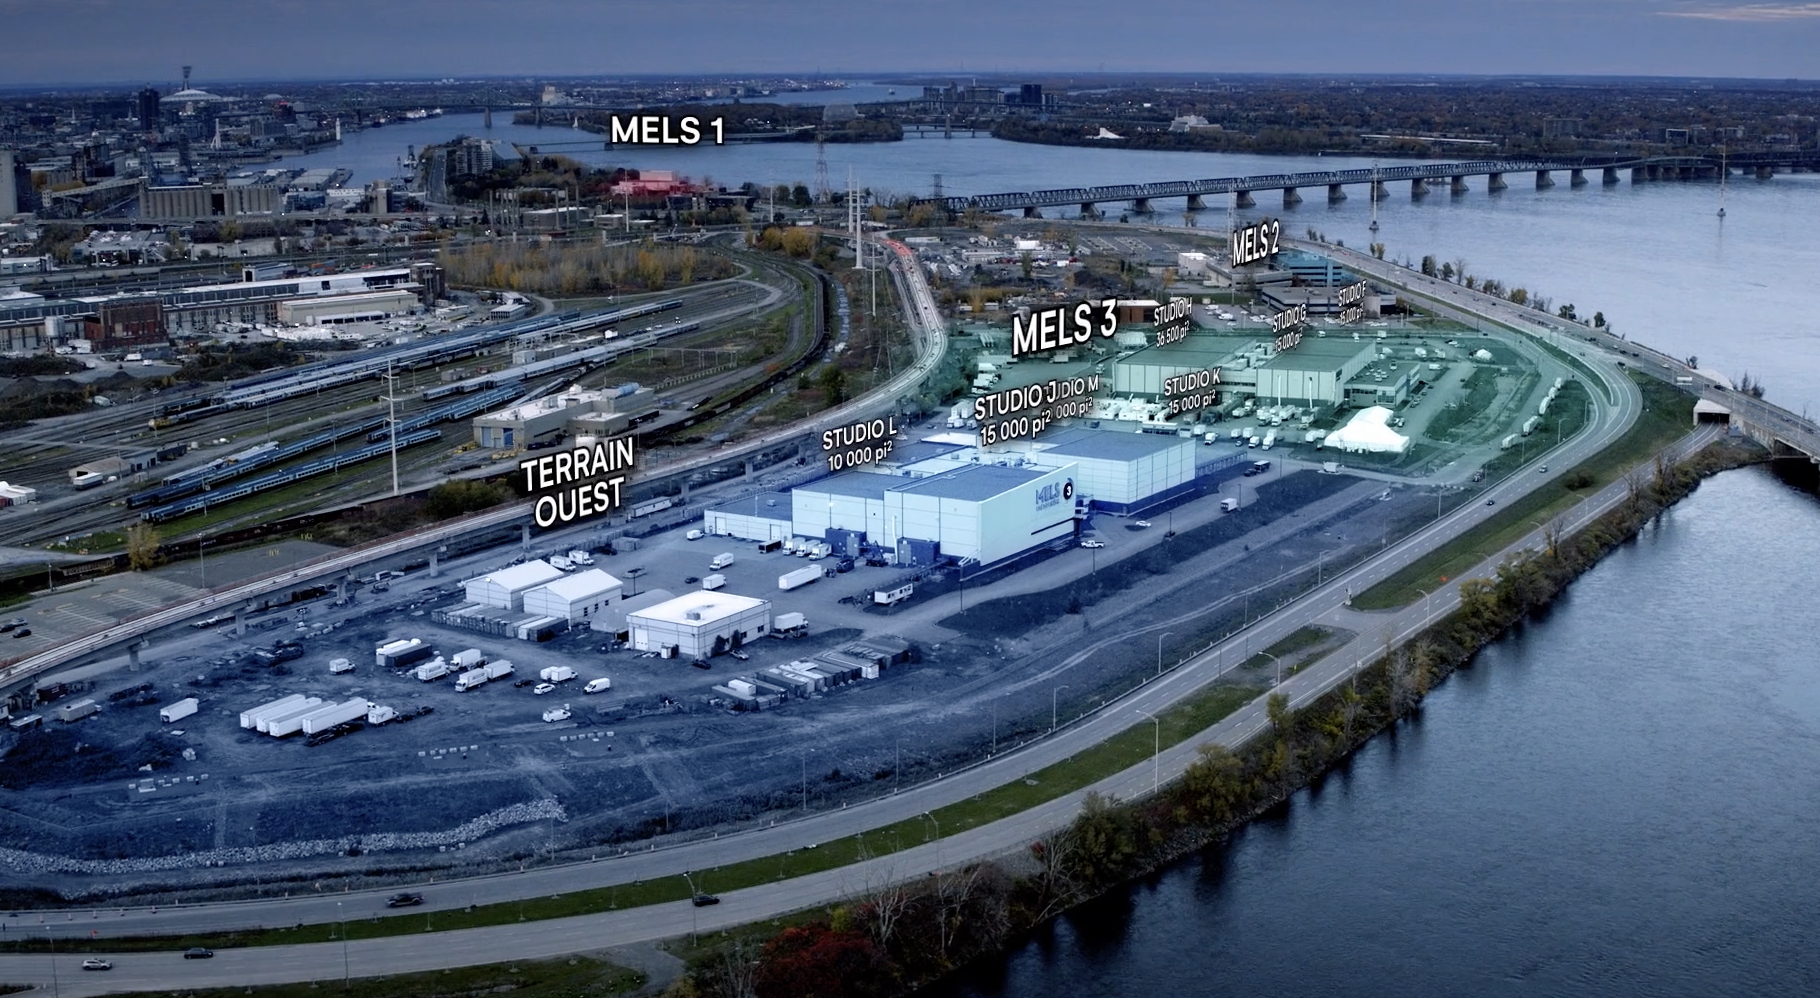
MELS runs out of two other properties also: one in Quebec City and another in Montreal that I couldn’t find confirmation that they owned the actual real estate. If they did, it would be added to the already surplus asset value the company has (see below section). The new Montreal property was developed a couple of years ago for $76m and is located right beside the other owned property but there was no real increase in PP&E in the 2021-2022 time frame for when it underwent construction so for now I won’t account for that value. According to ChatGPT, in 2026 there has been a range of industrial property sales in Montreal and the surrounding areas with the highest being $284/sq.ft against a low of $115/sq.ft.
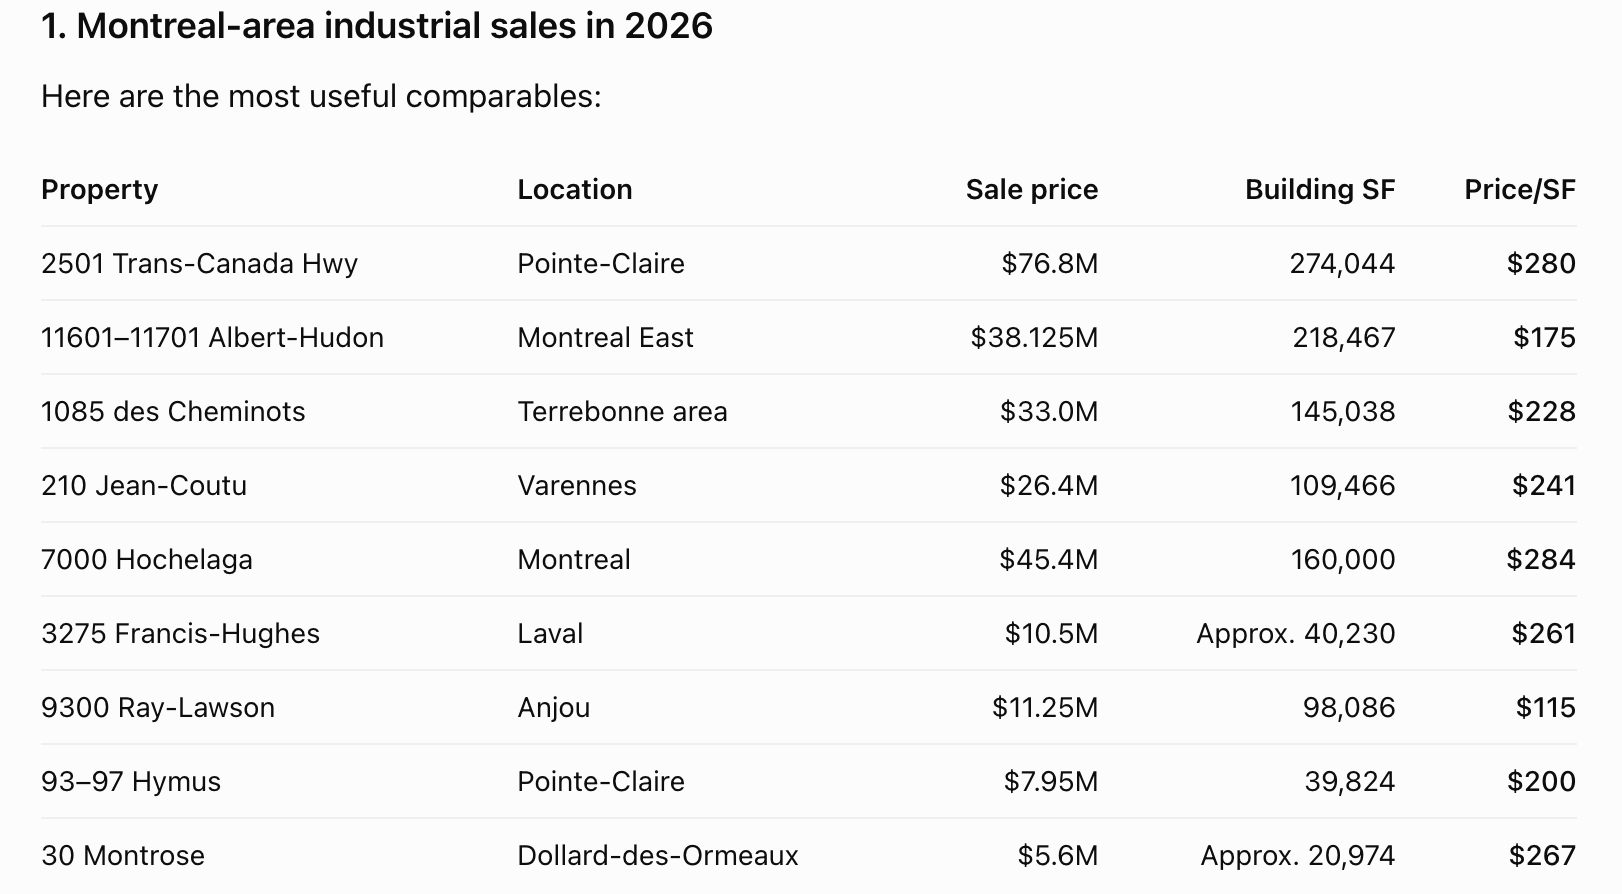
Using the lowest price of $115/sq.ft. comes up with a value of $57m for the owned MELS properties.
If you total each of the divisions up, and give no value to the Production and Distribution division, the total business value works out to $205m. And this is also on pretty conservative numbers and multiples. The company also has hard assets that provide a floor for the stock price.
Hard Asset Value
The company is currently sitting on the following excess assets:
1) $80m in cash and investments with $68m of that being cash
2) A surplus pension asset that shows up as $48m on the balance sheet but if you flip to Note 23 of the 2025 annual report you’ll see that it’s really $82.5m due to an “asset ceiling test”. Why the different numbers? According to IFRS accounting, if you have a plan surplus that is greater than the plan obligations, you can only recognize on the balance sheet the amount you are able to actually take out today. TVA has $268m on obligations against $350m of plan assets which nets to $82.5m of a plan surplus. Their asset limit reduction of $33.8m means that they can only recognize today $48.6m of the total $82.5m right now. It’s rare that pension plans are in a surplus and even rarer getting the excess funds out. The company could potentially take a contribution holiday, enter into a surplus-sharing agreement with employees or transfer the pension risk to an insurer by purchasing an annuity and eventually take the surplus out.
3) Surplus real estate. In 2023 the company moved out of their fully-owned headquarters in Montreal into Quebecor’s headquarters. They are in the process of redeveloping this real estate into residential units and submitted its plan to the city in 2025. The size of this property has been hard to pin down. The 2020 Quebecor annual report lists it as 285,550 square feet where as the 2021 20-F has the total owned area at 650,000 square feet. I believe the headquarter building is the 285,550 sf. but the total land complex (including the headquarters) is the 650,000 sf number.
There are some interesting comparables in this report that range from $84/sf to over $200/sf. Using the low range of $84/sf results in a value of the head quarter complex of $54.5m in excess real estate.
Total Value
If you total up each segment and add the surplus assets, you get a value approaching $9/share here vs the $3 stock price.
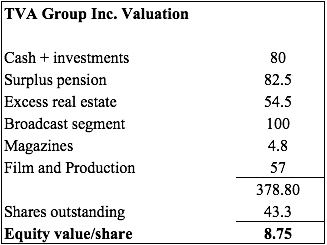
There are obviously a couple of reasons for this disconnect:
The Class B shares are non-voting and minority owned. Quebecor owns all of the voting Class A Shares and 65% of the Class B shares. The companies are essentially already operating as one with transactions and small dealings between them. And the business lines aren’t the best businesses in the world. They are in a slow decline.
BUT, they are profitable and backed by hard assets much greater than the market cap with a major shareholder who hasn’t appeared to act in an unfriendly manner toward TVA minority shareholders. This stock has run a lot this year and I believe still remains deeply undervalued.